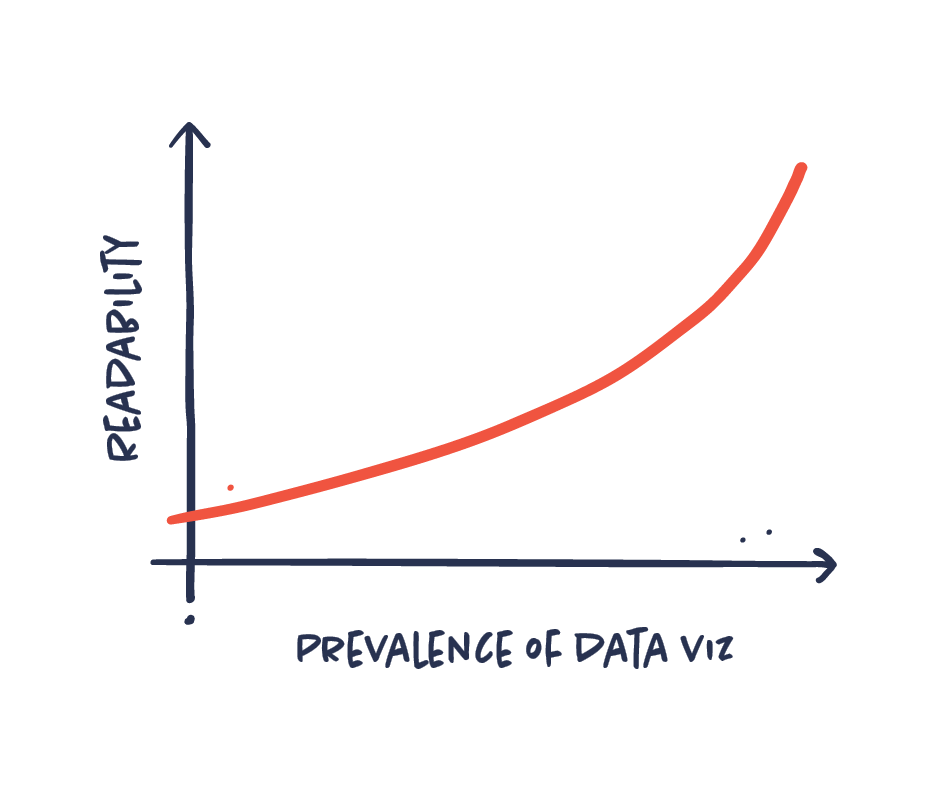
Use common data visualizations for common understanding
Data viz
October 9, 2019
Information designers sometimes tend to favor more exotic and artistic data viz types. Though this can be inspiring and useful, it is important to be aware of the readability and function of the chart types. Basic data visualizations like a bar chart or a line graph work because everyone knows how to read them. Choose the data viz type that conveys the message the best and the one that your audience will understand.
