Everything you need to know about data visualization
A short introduction to data visualisation: The what, the why and the how.
Data visualization becomes a superpower when dealing with large datasets, making it relevant for everyone to engage with. As the volume of data surges and its utilisation becomes more widespread, the ability to communicate through and with data has become utterly essential. Decoding, understanding, and conveying data can now be equated to basic skills such as reading and writing. Regardless of your industry or profession, data and the comprehension thereof are prerequisites today.

What is data visualization?
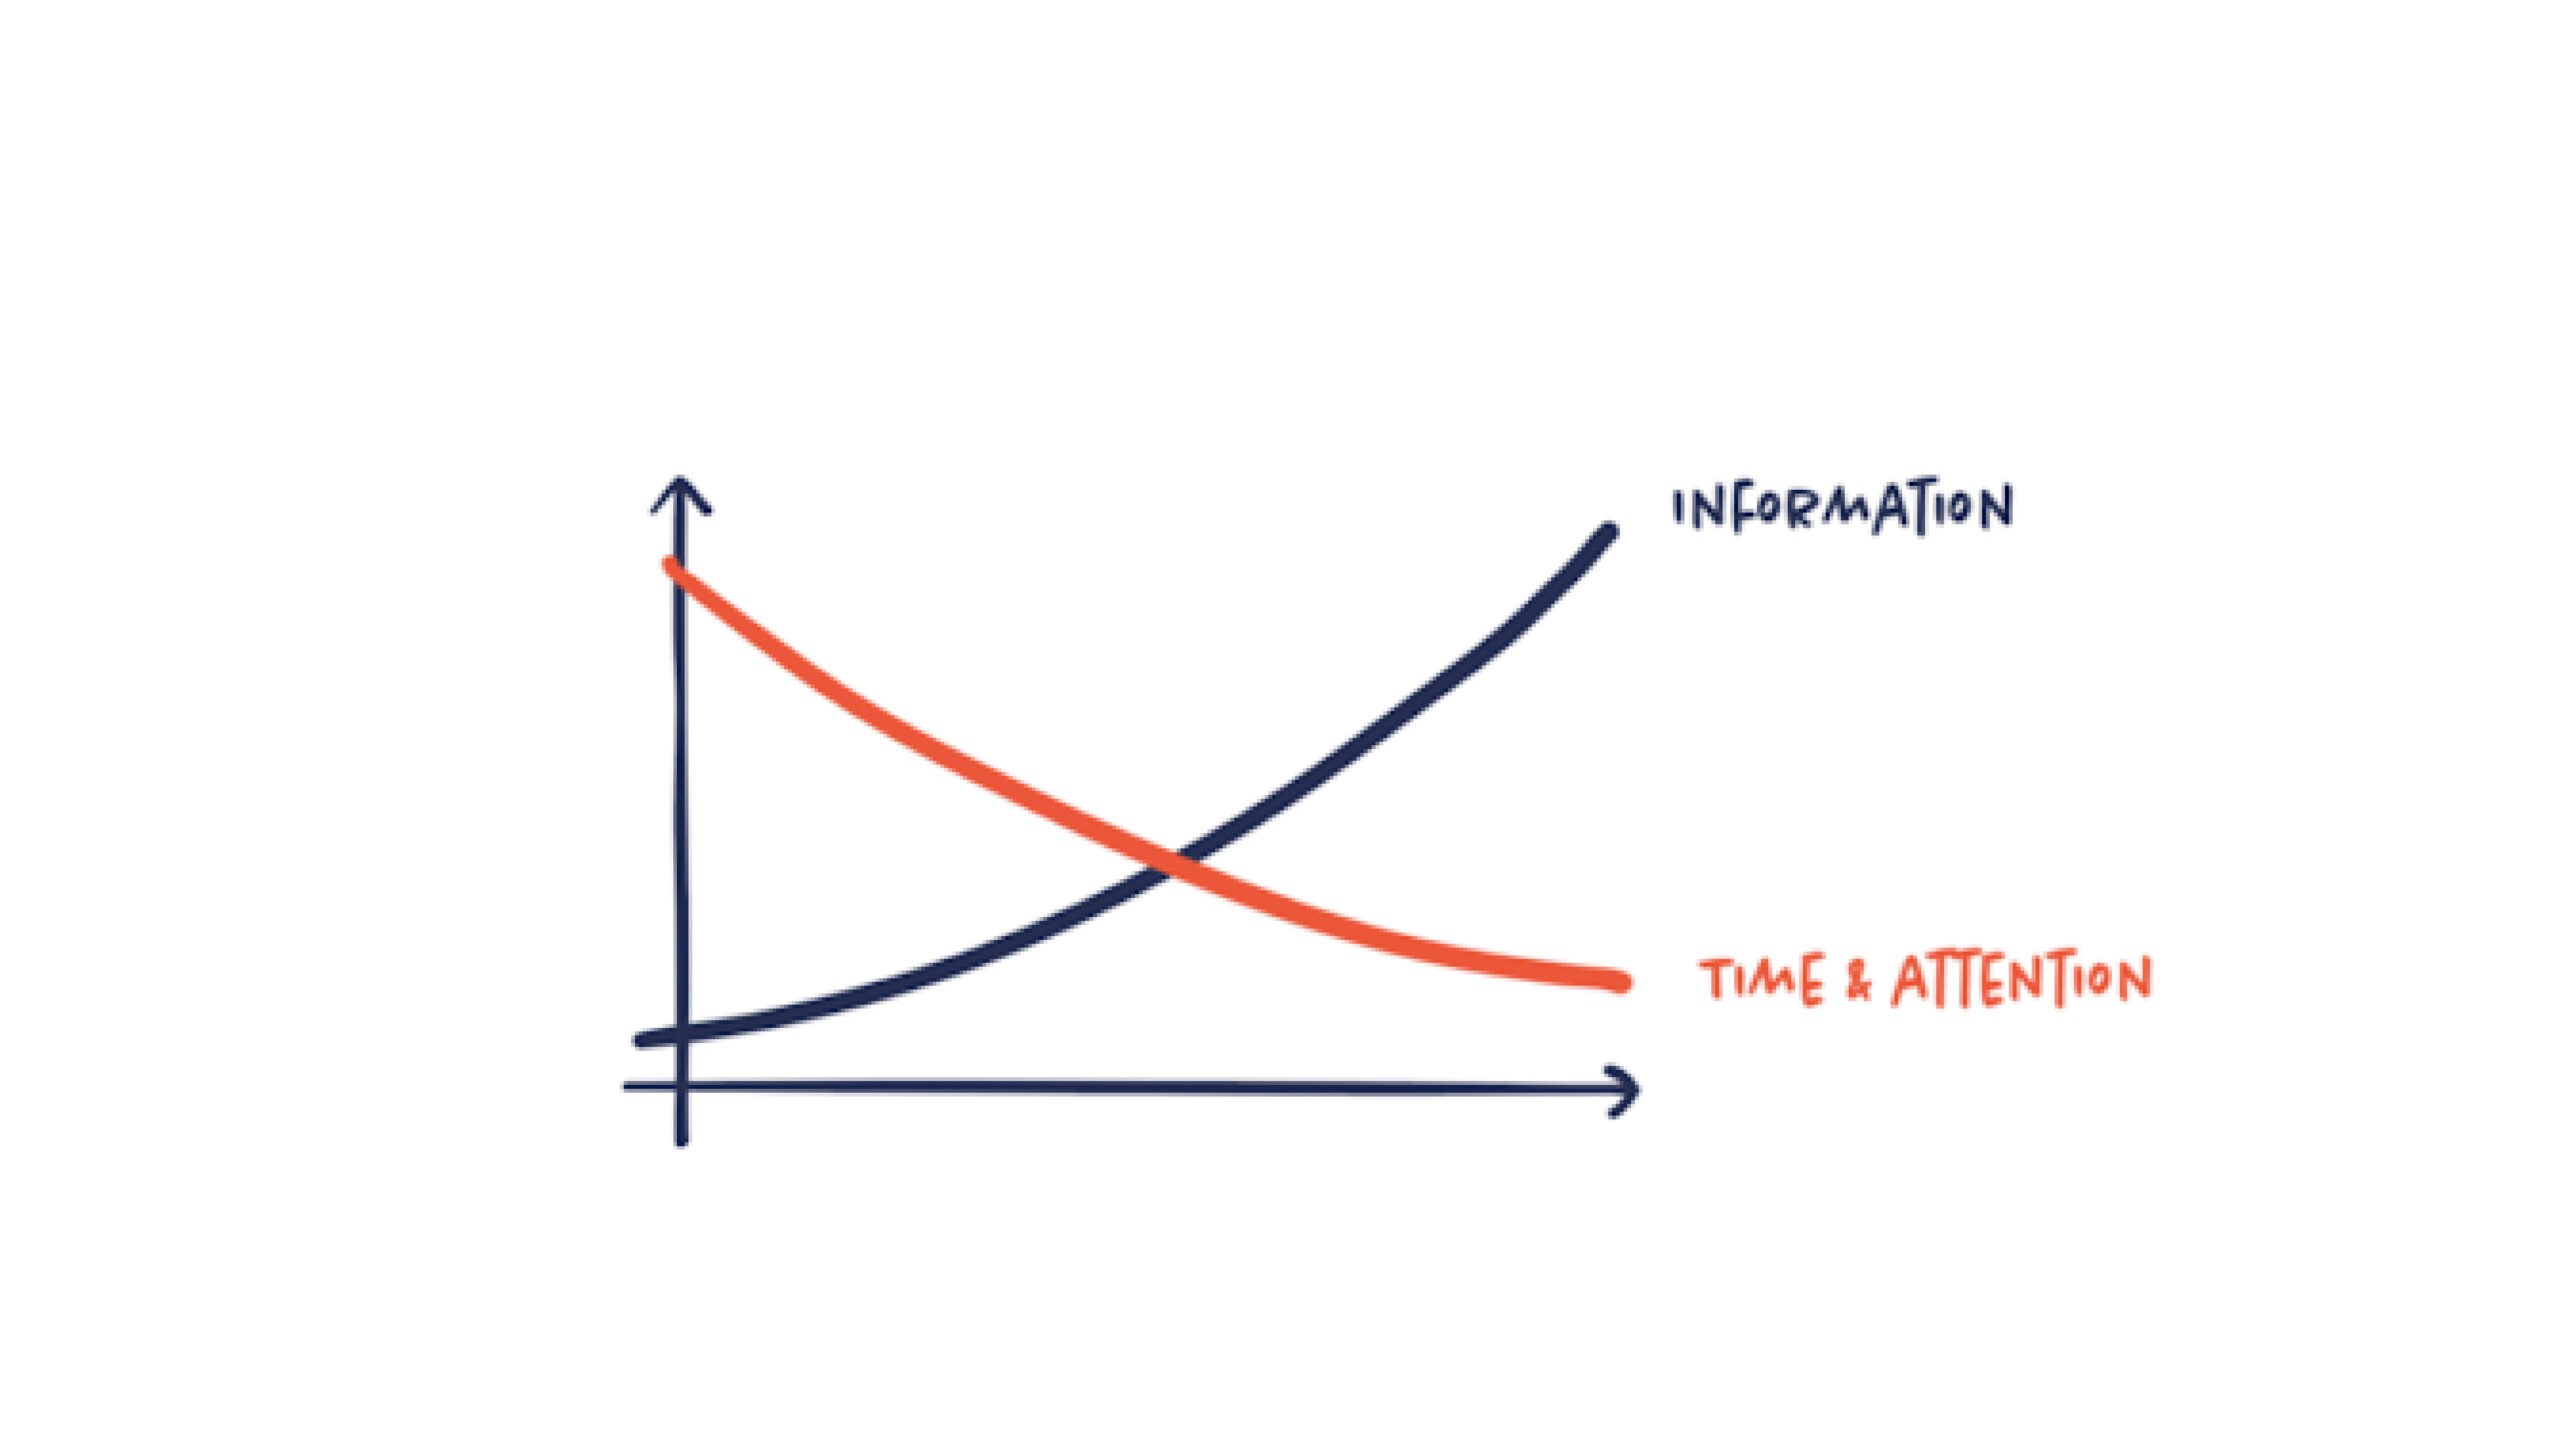
A data visualization is simply the presentation of data in a visual format. Utilizing graphic tools, complex data is translated into a clear, visual representation. In other terms, it’s about making data more accessible, understandable, and useful for your audience, be it in a sales presentation, report, or any other context.
Data visualization taps into human’s intuitive ability to recognize structures and patterns. Its primary goal is to replace data with visualizations, making it faster and easier to comprehend.
Take a simple test, for example: how long does it take you to count the number of fives in figures A and B below?
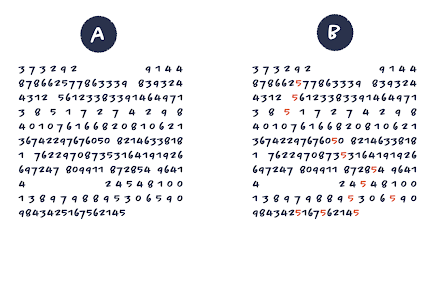
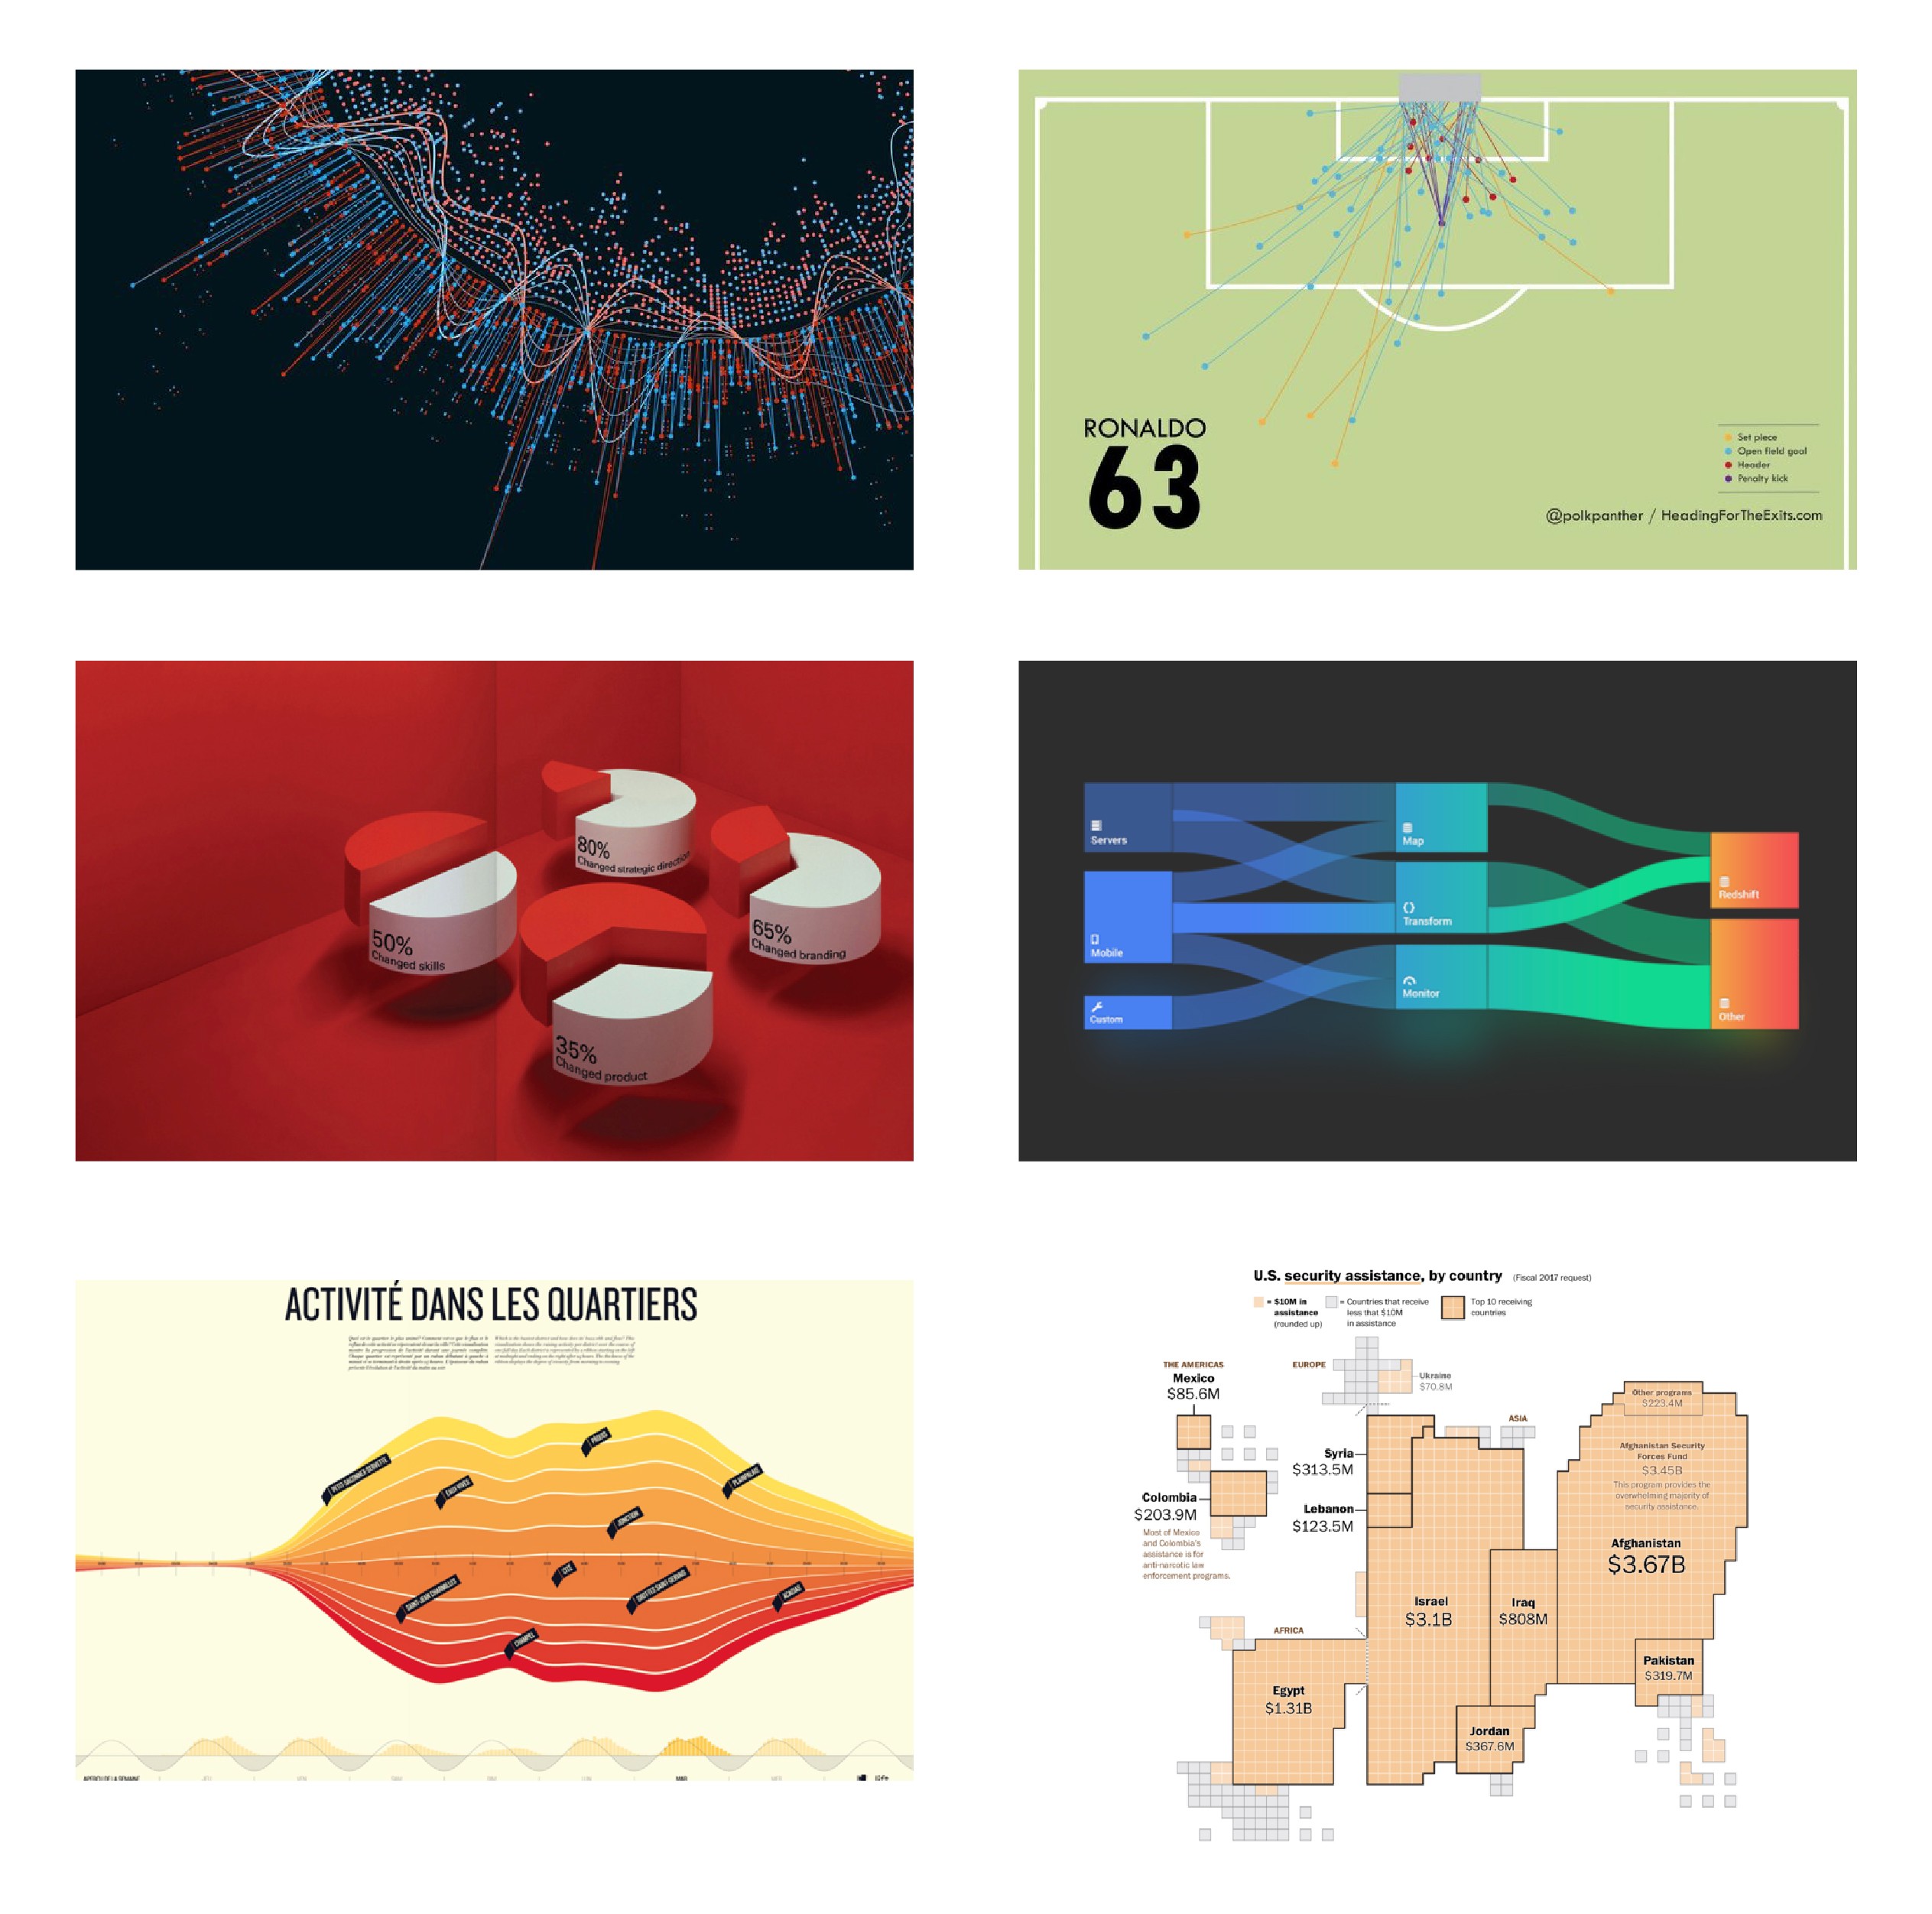
Even this basic way of visualizing a dataset using color makes it easier for our brains to process and discern a pattern. But there are countless ways to represent data beyond colors. Explore more methods here.

Why data visualization?
At its core, data visualization serves two purposes: to foster understanding and insight into your data and to convey data and insights clearly and effectively.
It’s about making data more accessible, understandable, and usable.
The concept has gained significant traction in recent years, aligning with the increase in data volumes and complexity. In fact, 90% of today’s data has been generated in the last 2 years, and this trend seems set to continue. As data accumulates within companies, there’s an ever-growing need to comprehend, analyze, communicate, and draw conclusions from all the collected data. Hence, data visualization demands greater attention in companies today, whether it involves annual reports, PowerPoint presentations, dashboards, Excel, or something entirely different.
How to create data visualization?
The process of data visualization isn’t generic or expressible in a precise formula. There are various levels at which one can work with data visualization. But to simplify, let’s break it down like this:
- Collect data. What data is relevant?
- Sort your data. How is your data connected?
- Analyze your data. Are there any patterns? What’s the story?
- Visualize your data. How can it be visualized most effectively?
How do I get started?
There are numerous ways and levels to work with data visualization. Most people at some point have had to communicate numbers or data in their work or education. Therefore, it’s a discipline relevant to engage with at some level, almost irrespective of your professional profile. However, it’s also a discipline where you quickly need technical, analytical, and design competencies and may need to pass the task on to specialists.
In recent years, a plethora of digital tools have emerged to aid in visualizing data. These tools are often used for advanced and heavy data visualization that was previously impossible to achieve. However, just because it’s possible doesn’t necessarily mean it’s a good idea. It’s crucial to let the story you want to tell dictate how you visualize your data, not the tools at your disposal. Visualization should complement the story, kept as simple as possible to ensure your message shines through clearly.
It’s easy to get dazzled by the many options for creating data visualizations, so it’s important to keep in mind what you want to convey.
Get started now!
Interested in learning more about data visualization and information design? Or need assistance with your next project? We specialize in information design and visual communication with experience from over 300 projects. Reach out in the chat or by e-mail or phone.