The Danish Institute for Human Rights
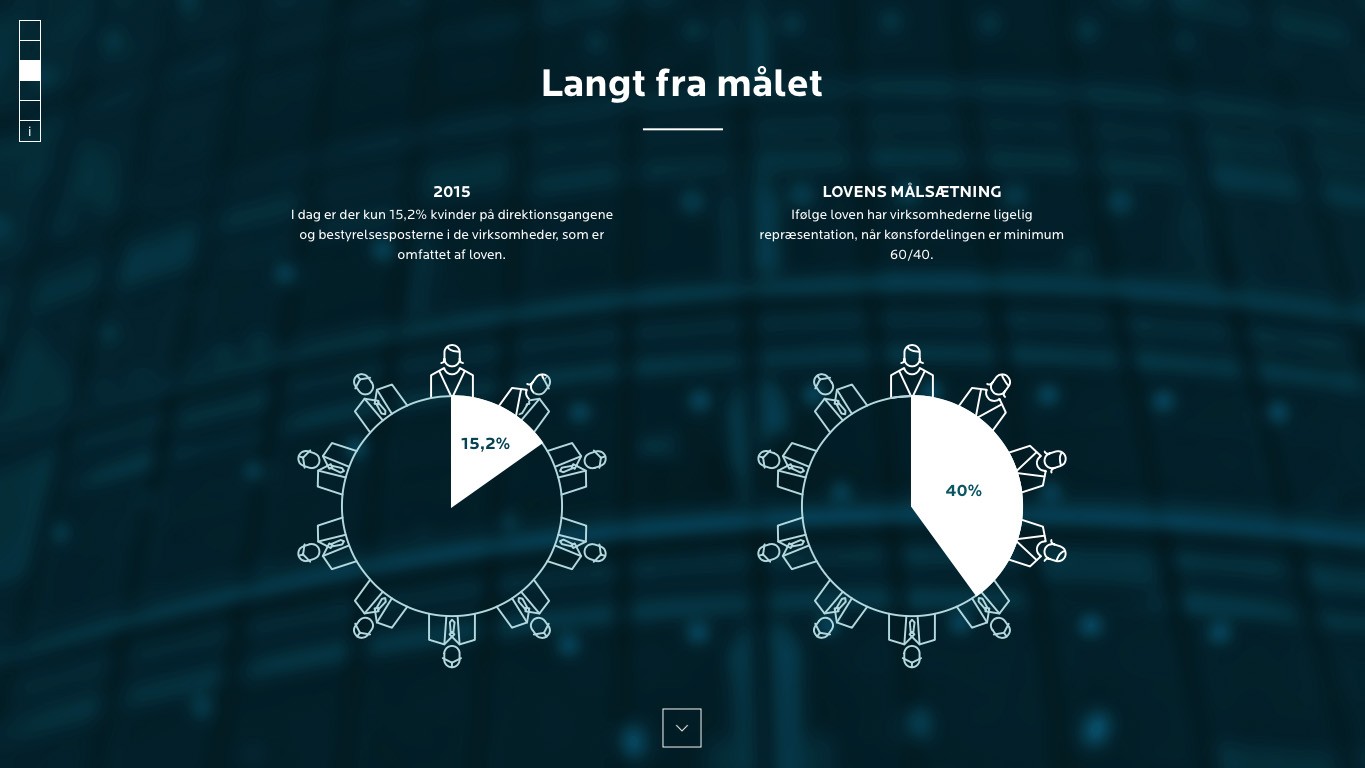
Women in Management
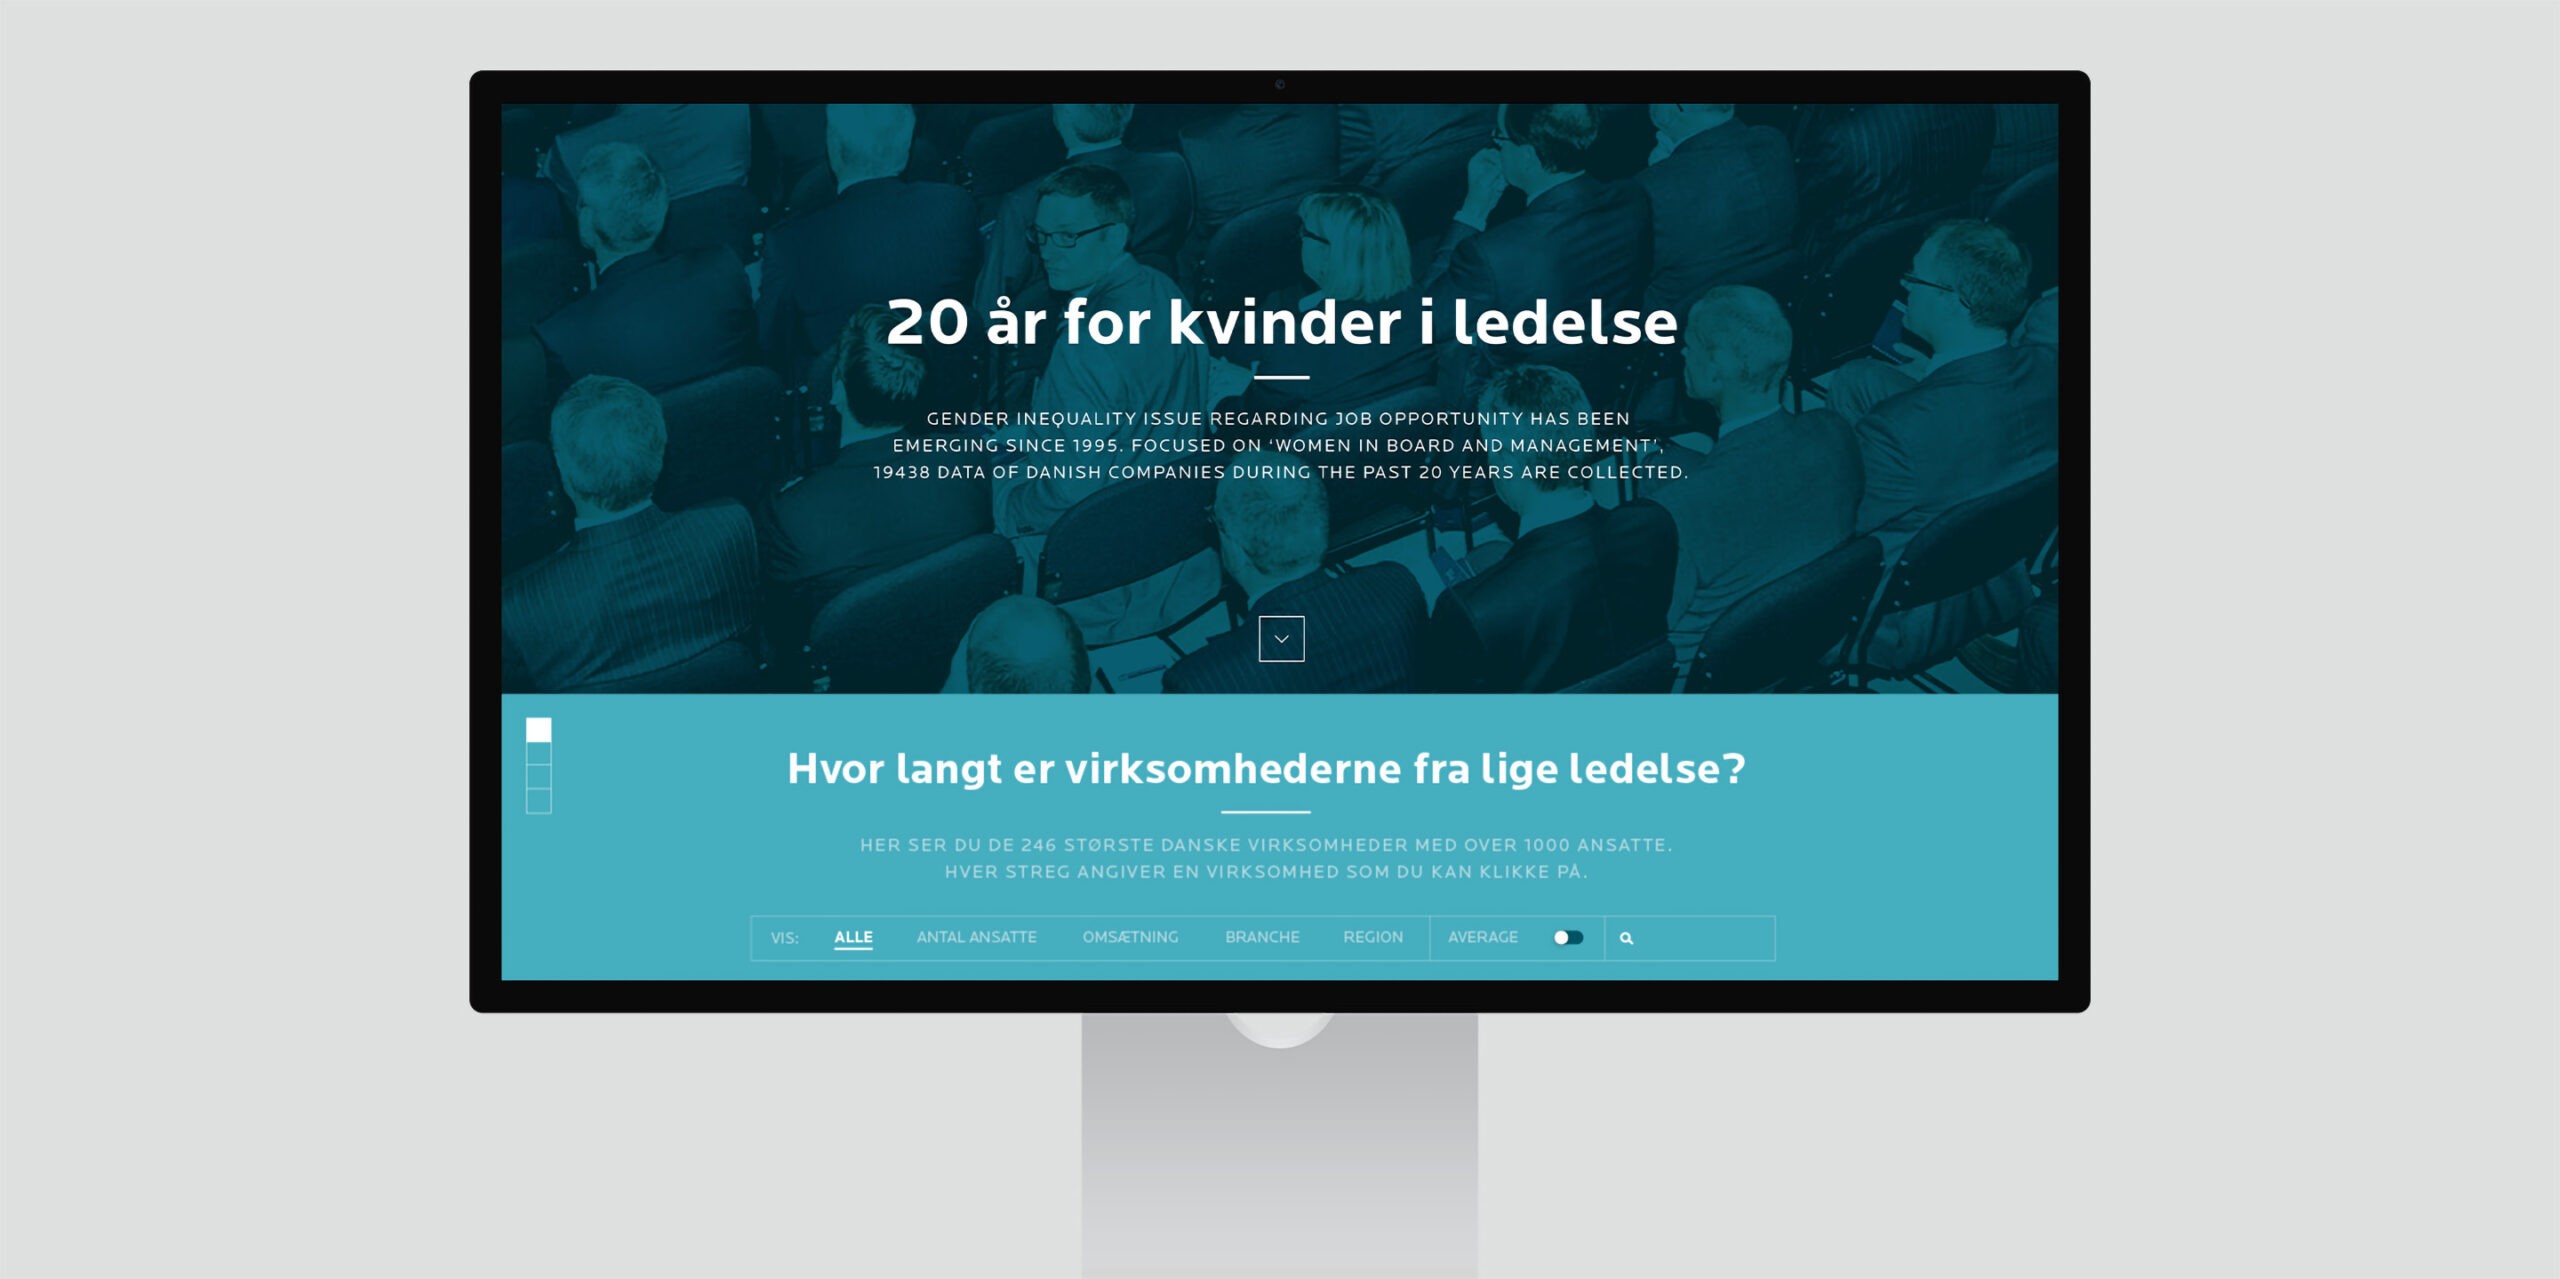
The Danish Institute for Human Rights conducted a comprehensive study of how Danish companies follow the rules of equity when it comes to women in management and boards for the past two decades. We transformed the dataset into an interactive website to share the stories in a new and engaging way.
Explore the data yourself
The dataset was quite massive consisting of data from more than 1,200 companies for the last couple of decades. One of the main features of the website was to allow users – especially journalists – to explore the enormous data set and find stories themselves in an easy and intuitive way including year, region, industries, company size among others.
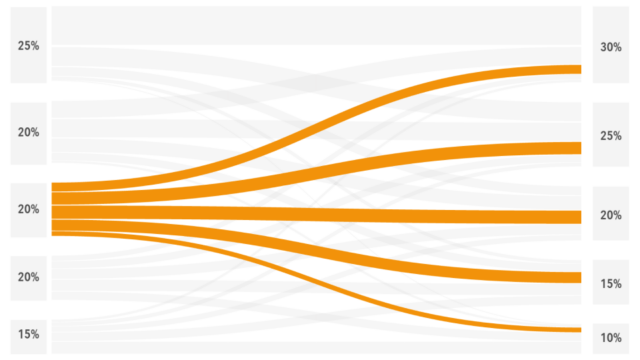
Draw and guess yourself
Instead of simply displaying the share of women in management for the past 20 years in a line chart, we asked the users to guess and draw it themselves. This way we encourage the readers for better reflection, engagement and awareness.
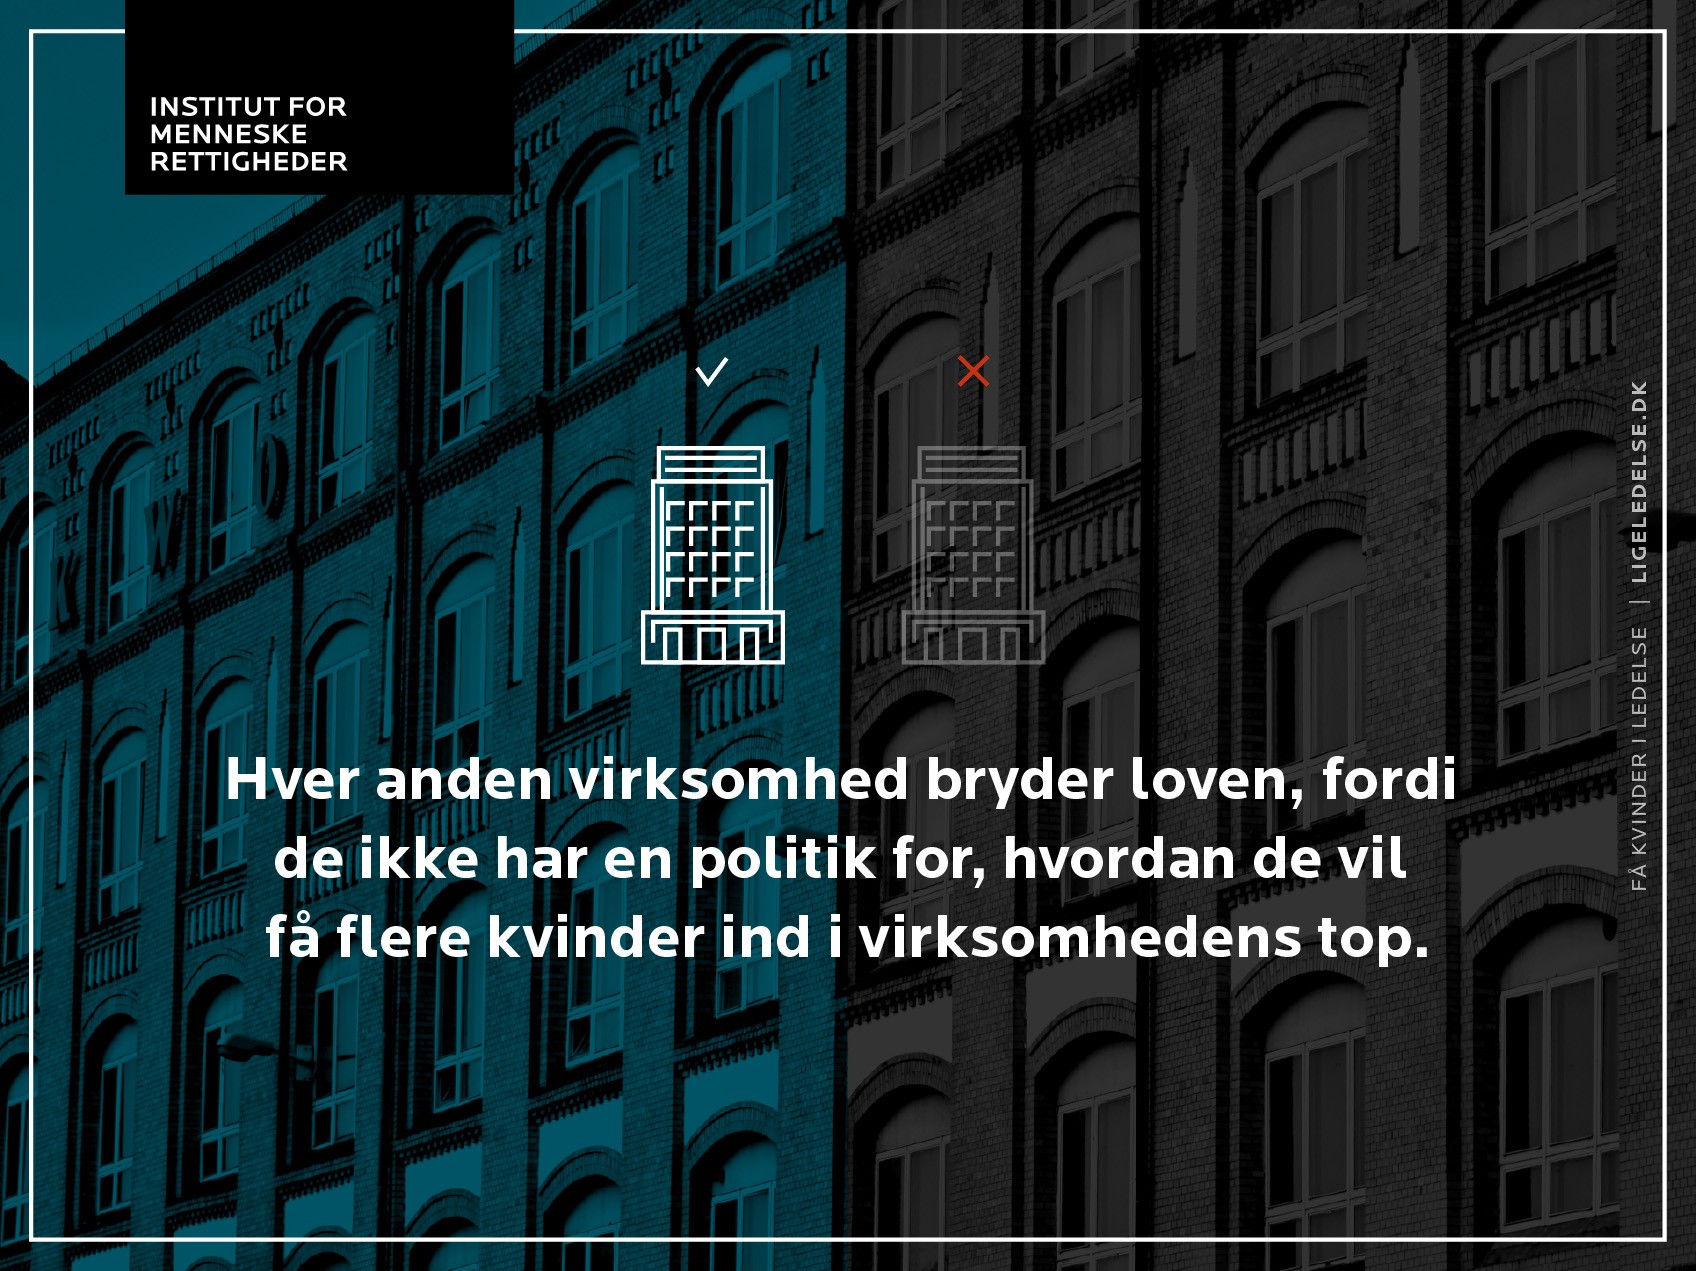
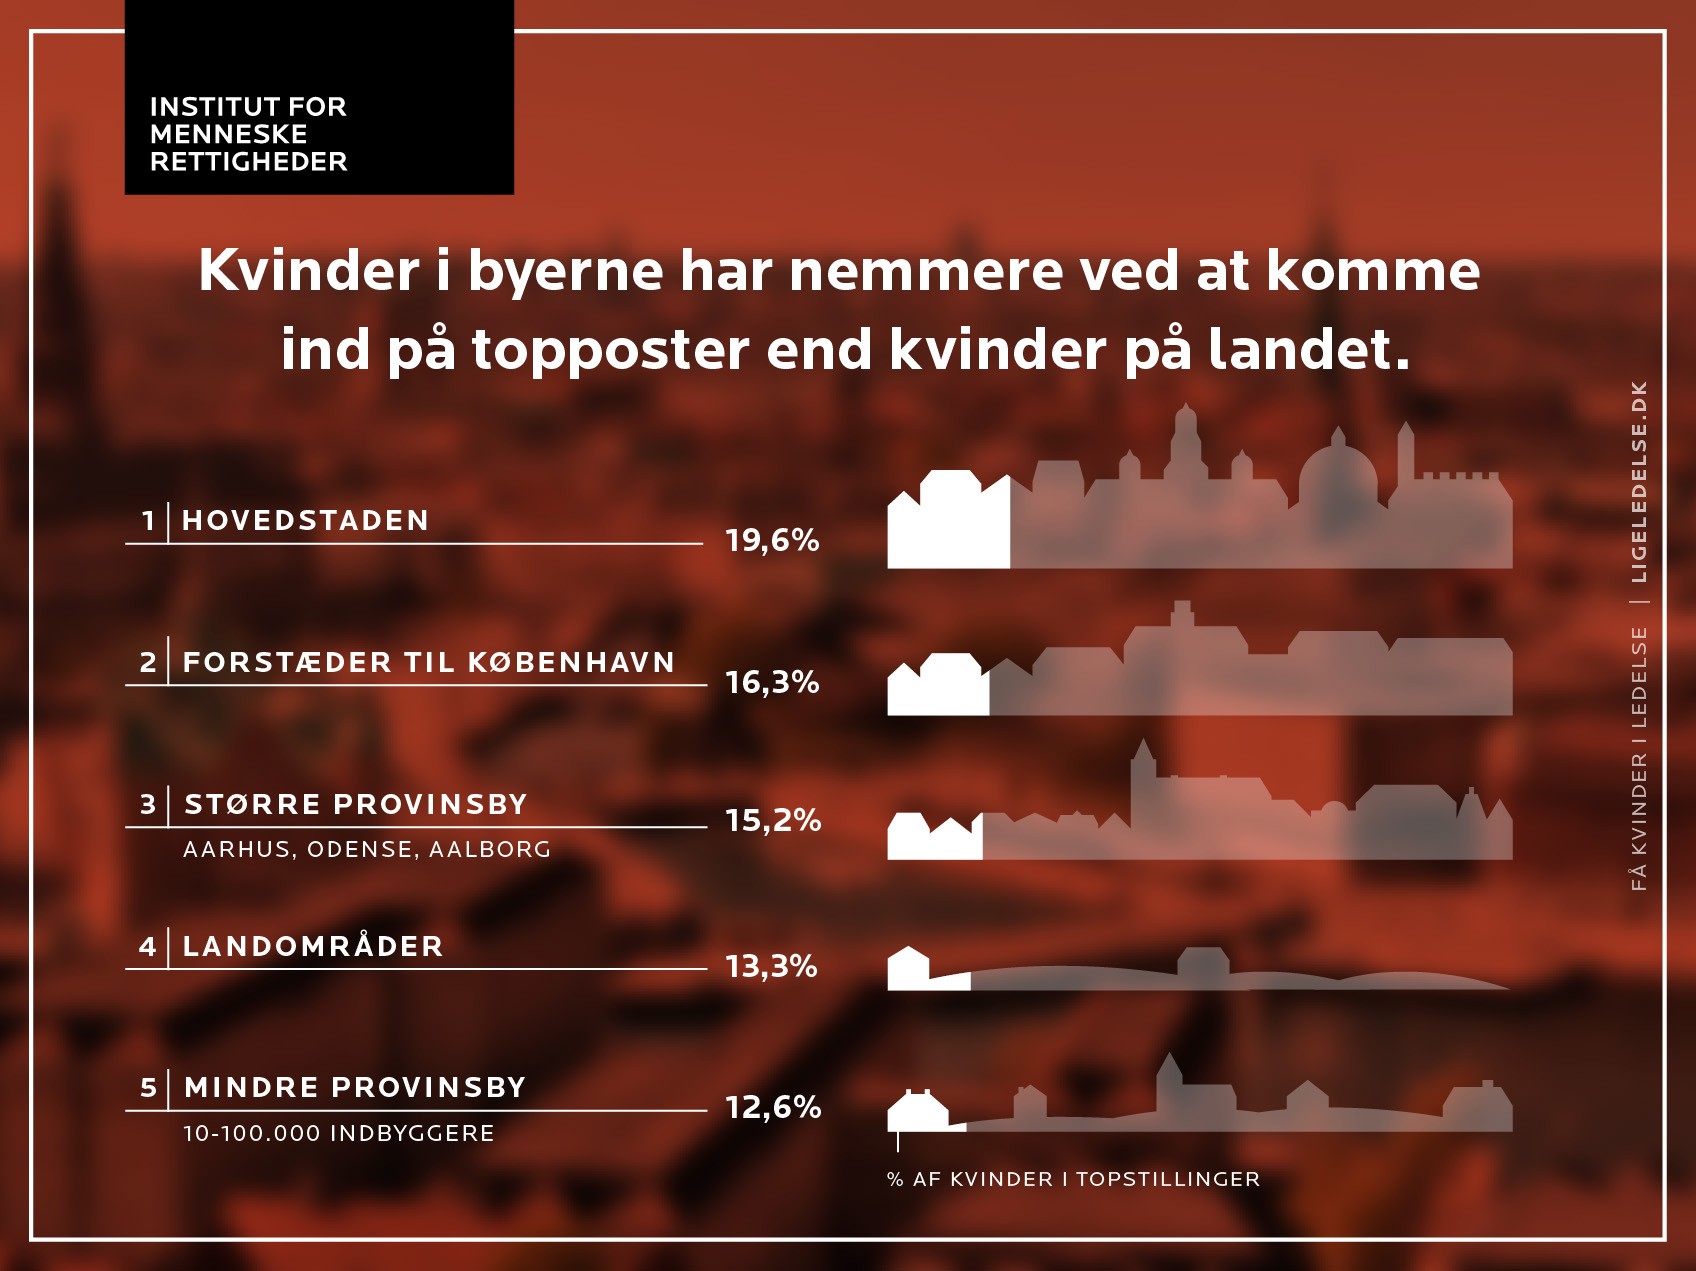
Shareable infographics
To complement the explorative features of the website, we also included some of the most important conclusions as simple and clear infographics to be shared.